If you’re a teacher or parent, you’ve probably heard your students or children use one (or many) of these adjectives when describing math: booooring, hard, pointless, frustrating. Maybe they’ve asked you why they should learn anything other than addition and subtraction. Ever tried, “You’ll need math to defeat a zombie horde” as a rebuttal?
You’d be surprised how relevant math can become with a little creativity! Here are three ideas for making math matter.
1. Win Big at Rock-Paper-Scissors

Rock-Paper-Scissors has been a perennial favorite on playgrounds, in school cafeterias, and on ball fields for as long as anyone can remember. It’s used to decide who goes first, who gets the best swing, and who wins big by getting the last chocolate pudding on the Thursday lunch menu. But did you know that you can use the math behind the game to consistently win?
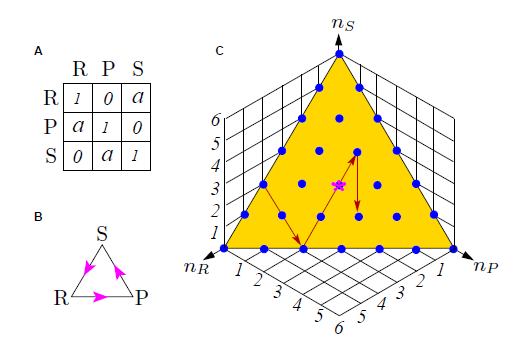
Zhijian Wang at Zhejiang University in China and a couple of pals say that there is more to Rock-Paper-Scissors than anyone imagined. Their work shows that the strategy of real players looks random on average but actually consists of predictable patterns that a wily opponent could exploit to gain a vital edge.
The results reveal a surprising pattern of behavior. On average, the players in all the groups chose each action about a third of the time, which is exactly as expected if their choices were random.
But a closer inspection of their behavior reveals something else. Zhijian and co say that players who win tend to stick with the same action while those who lose switch to the next action in a clockwise direction (where R → P → S is clockwise).
It’s called Game Theory and it has the potential to change the face of the playground—and math classroom—as we know it.
2. Graphing the Zombie Horde, Surviving the Zombipocalypse
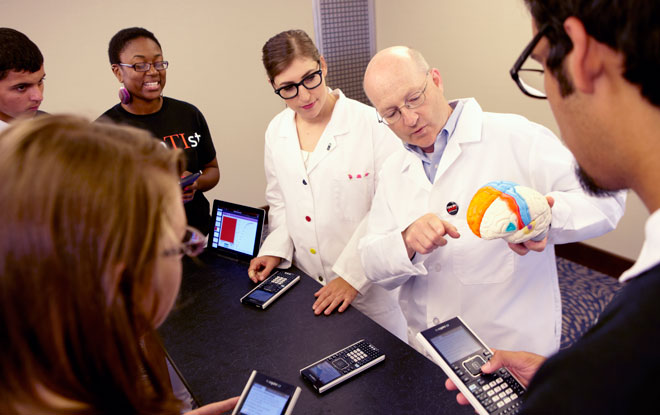
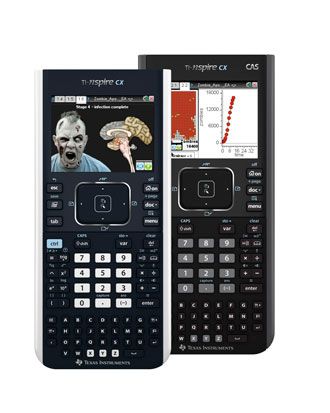
Graphing calculators have come along way in the Digital Age. Texas Instruments now has a graphing program that capitalizes on middle and high school students’ fascination with walkers (that’s the scientifically “correct” term for zombies, for all you readers not obsessed with The Walking Dead).
How does it work? Simple!
The program uses models of zombie outbreaks loaded onto TI graphing calculators, computers, or iPads to demonstrate everything from brain damage (natch) to the patterns in which disease spreads.This presents the opportunity for modeling, for teaching about graphing, for teaching about disease progression, for teaching about the problem-solving that would be involved if you were to, for example, work for the Centers for Disease Control and had to analyze this.
Go forth. Graph the zombipocalypse.
3. We Live in Cities
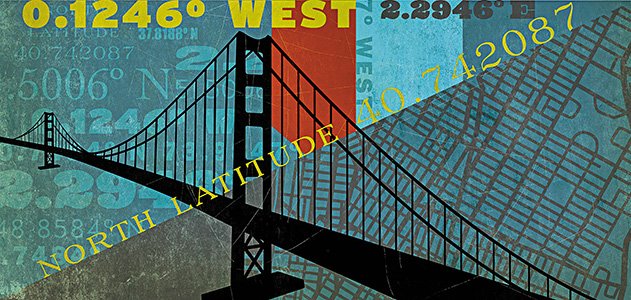
(Illustration by Traci Daberko)
More than 80% of the United States population lives in urban areas. If you and your students are included in this 80%, you might want to check out the emerging field of Quantitative Urbanism—bringing method to the madness through math.
What people do in cities…shows a relationship to the size of the city. The relationship is captured by an equation in which a given parameter—employment, say—varies exponentially with population.